Increasing the reputation of Business Intelligence teams within an organization
Business intelligence (BI) teams play a crucial role in helping organizations make informed decisions and achieve their goals.
Intro
Having worked in diverse teams across multiple industries, I have always been curious about the role and impact of BI and Data teams—how to measure their performance, enhance their influence, and elevate their reputation within an organization. Achieving this requires a strong foundation in data democratization and data literacy, ensuring that insights are accessible, trusted, and effectively used across all levels of the business.
Business intelligence (BI) teams play an important role in helping organizations make informed decisions and achieve their goals. However, establishing and maintaining a strong BI team can be challenging.
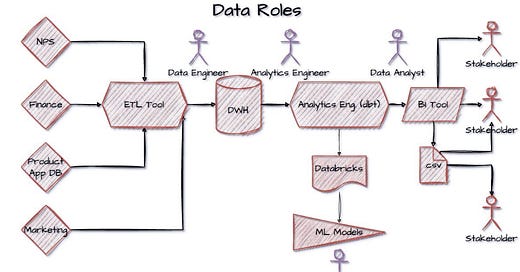
Creating a high-performing Business Intelligence (BI) team isn’t just about filling seats—it’s about strategically selecting experts whose skills align with the organization’s unique data challenges. Each role serves a distinct purpose, and overlooking these critical positions can leave gaps that undermine data-driven decision-making. It’s critical for the hiring and management teams to choose not onl;y the correct people but also the correct roles for the team. I’ll try to group up some roles and will not dive into much detail on how they differ in large/huge scales. Here’s how to align hiring with business needs:
1. BI Analyst / Data Analyst
When business leaders clamor for answers but drown in spreadsheets and DWH tables, a Data Analyst bridges the gap. They transform messy data into clear KPIs, dashboards, and ad-hoc reports, ensuring stakeholders base decisions on facts—not hunches. Companies lacking analysts often rely on error-prone manual processes, resulting in misaligned strategies and missed opportunities. They can deliver .CSVs, Dashboards, ad-hoc queries to non-technical people, they can communicate efficiently with stakeholders. Stuff that a data engineer is not that willing to do.
2. Data Engineer
This is currently the most in-demand role. Companies have realized that hiring data analysts and data scientists alone is not enough to drive business success. This is because, in most cases, integrating data from various sources requires working with APIs, building complex data pipelines to transform data into the required format, and orchestrating these pipelines efficiently—none of which are trivial tasks.
Data quality checks are also critical. While analysts may be able to handle some of these tasks, the ideal candidate is someone deeply involved in the entire data pipeline, from front-end ingestion to back-end storage and processing. A great data engineer is not only technically skilled but also highly curious, constantly seeking better ways to optimize data workflows and ensure seamless integration across systems.
3. Data Scientist / ML Engineer
If your business is stuck reacting to trends instead of anticipating them, a Data Scientist unlocks the next frontier. They deploy machine learning and statistical models to predict outcomes, automate processes, and uncover hidden opportunities. Skipping this role means settling for hindsight—not foresight—leaving competitive advantages untapped. For example, in e-commerce a data scientist can develop recommendation engines that personalize customer experiences, increasing sales and retention. In finance, they can create fraud detection models that analyze transaction patterns in real time to prevent losses. In healthcare, they enable predictive analytics to identify at-risk patients and recommend early interventions.
Why Role-Specific Hiring Matters
A well-structured BI team operates like a finely tuned engine: every part has a purpose. Hiring a BI Engineer without a Data Analyst leaves insights buried in pipelines. Employing a Data Scientist without a BI Developer means predictive models never reach decision-makers. The right mix & match of roles ensures data isn’t just collected—it’s translated into actionable intelligence that drives growth, efficiency, and innovation. It’s important to align hiring with strategy.
Clearly define the team's mandate and responsibilities
It is important that the BI team's mandate and responsibilities are clearly defined and understood by all stakeholders. This will help the team focus on its core objectives and deliver value to the organization. It can play significant role to communicate efficiently the mission of the team within the organization.
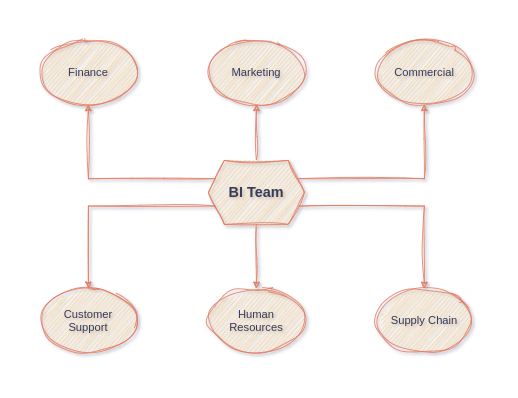
The BI team's mandate might be to act as a data hub and support initiatives regardless of teams invloved. Alternatively, it can support specific team(s) because of complex data or lack of analysis skills.
Build strong relationships with other teams
BI teams often work with a variety of teams within an organization, such as sales, marketing, and operations. Building strong relationships with these teams can help the BI team understand their needs and priorities, and ensure that their work is aligned with the organization's goals.
Clearly communicate the value of the business intelligence team's work: Make sure other teams understand how the insights and data provided by the team can help them achieve their goals and make better decisions.
Be responsive to other teams' needs: Show that the team is responsive to the needs of other teams by quickly addressing their requests for data and insights.
Share knowledge: Share the knowledge and skills of the team with other teams. This will help other teams become more self-sufficient in using data and insights to support their work.
Be transparent: Share the team's process and methodologies to gather, analyze, and present data. This will help other teams understand the context and limitations of the data they are working with.
Encourage feedback: Encourage other teams to give feedback on the work of the BI team. This will help to improve and better serve the needs of the organization.
Hold regular meetings: Hold regular meetings between your team and other teams to discuss upcoming projects, share progress and results, and address any concerns or issues.
Show results and celebrate: Share the results and impact of the business intelligence team's work with the rest of the organization. This will help other teams see the value of the work that the BI team does and how we work together to achieve shared goals.
Communication channels like Slack and Microsoft Teams are really useful to communicate goals, strategy and defined boundaries on how the BI/Data team works. This can significantly reduce the number of questions that your team will receive. You really do not want your team to be DOOMED of useless questions and dashboard requests from everyone. In any case, your data will end up in an excel file, so you have to protect the team and choose wisely when this is necessary or not. Does this sound familiar to you?
Continuous learning
BI teams should be committed to staying up-to-date with the latest technologies and best practices. Encouraging team members to attend conferences, workshops, and training sessions can help the team stay at the forefront of the field.
Encourage cross-training: Encourage members to learn about the work of other teams, and vice versa. This will help build understanding and appreciation for the work of different teams and the skills they bring to the table.
E.g Establish Quarterly meeting with the teams that you collaborate the most.
Create opportunities for learning: Set up regular training sessions, workshops or seminars where BI staff can share their expertise with other teams, or where other teams can share their knowledge with them.
E.g Establish cycles of training (6 Months) not only for the BI Tool but also for the organization’s data.
Create a mentorship program: Set up a mentorship program where the BI team can mentor less experienced members of other teams, and vice versa. This will help build trust and understanding between team members.
E.g Match data team’s members with a corresponding analyst/stakeholder which works for another dept/team.
Encourage experimentation: Encourage the team to experiment with new technologies, techniques, and methods. This will help everyone learn and grow.
E.g Give opportunities to line staff members with experimentation and POCs in tools or MVPs in projects.
Share best practices: Share best practices and lessons learned either between team members or other teams. This will help everyone learn from the successes and failures of others.
E.g Establish an internal mechanism and mentality which indicates that sharing is caring. Surpass the mentality that sharing is ‘showing off‘ yourself.
Make use of modern learning technologies: Encourage the use of online resources and digital learning platforms to access training, tutorials and other educational materials.
E.g Paid learning platforms, DataTalks club etc. Always stay up to date with tech and trends.
Celebrate success: Recognize and celebrate the successes of both BI and other teams and how they have grown and developed through learning. Retro sessions are a great way to measure the progress.
E.g Take accountability but don’t forget to celebrate. Have drinks with your team to celebrate success.
The 1% principle is a simple yet powerful concept that has the potential to drive incredible growth in our businesses without requiring a monumental effort. It all comes down to consistently doing just 1% more than expected or required of us.
Deliver value
The most effective way to increase the reputation of a BI team is to consistently deliver value to the organization. This means providing insights and recommendations that drive meaningful business outcomes.
Lead by example: Lead by example and demonstrate the importance of data-driven decision making and collaboration in your own work.
E.g Highlight team’s contribution in a company’s significant project. Spread the word. You made an impact.Understand the business: Take the time to understand the business goals, objectives, and strategies of the organization. This will help you to provide insights and data that are directly relevant to the business.
E.g Learn the business. Everything from everyone. Be curious. The team is there to help the business and not to work on academia datasets like IRIS.Provide actionable insights: Provide insights and data that are actionable, meaning they can be used to make decisions and take actions that will drive the business forward.
E.g Match insight with actionable. Otherwise, it’s not an insight. Quarter over Quarter sales decreased by 10%, the team discovered that email open rate decreased by 30%. We should explore the reason behind it and try to lift it.Be timely: Provide insights and data in a timely manner, so that they can be used to support decision-making and inform the direction of the business.
E.g Speed vs Quality is always the case. This is not a research paper, but you also have to do it correct. Ensure data quality and deliver. No, you don’t need this super fancy visualization or that 15 page pdf document. There’s an entire suite of KPIs for data team performance that includes metrics such as time of request to insight, insight to action etc.Communicate effectively: Communicate the insights and data provided by the BI team in a clear and concise manner, so that they can be easily understood and acted upon by decision-makers.
E.g One of the most underrated skills is data communication. You may code like a pro hacker, creating the best analyses or ML model. If you cannot communicate to the C-Level suite or the Board Of Directors, the impact of this work, it may ends up the Project graveyard. As you climb the ladder, soft skills make the difference. Describe the beginning, the middle and the end.Use the right tools: Use the right tools and technologies to collect, analyze, and present data. This will help to deliver insights and data in an efficient and effective manner.
E.g Experiment. Your software engineers may prefer to code in cloud and Terraform needing 1 week and 10 hours per month for maintenance and development, while databricks can deliver value in 5 minutes with a cheap solution.Be flexible: Be flexible and responsive to changing business needs and priorities. In this way, you can deliver value to the business in a timely and effective manner.
E.g Things change. The world changes. Adapt and adopt. You may need to change your tech stack or the priorities. Listen actively, process, act. You may need to kill your project, yes. In project management, kill switches and culling exercises are essential tools for maintaining efficiency and minimizing risks. A kill switch is a predefined trigger that prompts a reassessment of a project's viability, preventing unnecessary investment in failing initiatives. For example, in a software development project facing persistent delays and budget overruns, invoking the kill switch allows stakeholders to halt further losses and redirect resources.Measure and report on the results: Measure and report on the results of the BI team's work in terms of how it has helped the business to achieve its goals and objectives.
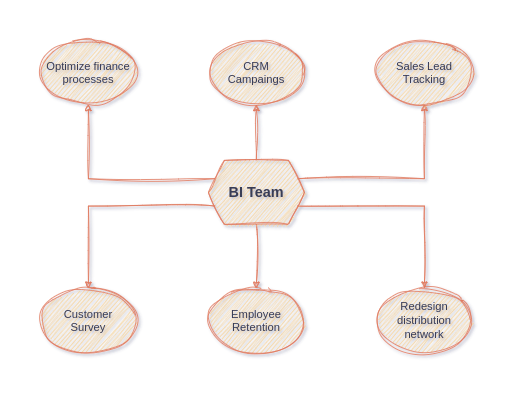
E-commerce Sales Performance Dashboard: Developed a real-time dashboard tracking sales, customer acquisition costs, and product performance.
Identified underperforming products, leading to targeted promotions that increased sales by 12%.
Optimized pricing strategies, improving revenue per customer by 8%.
Automating Financial Reporting: Built an automated financial reporting pipeline, reducing the need for manual data extraction and reconciliation.
Saved 200+ labor hours per month, allowing finance teams to focus on analysis rather than data gathering.
Reduced reporting errors by 30%, improving decision accuracy.
Churn Prediction Model in a Subscription Business: Developed a machine learning model to identify customers likely to churn based on usage patterns and feedback.
Implemented targeted retention campaigns, reducing churn from 10% to 7% in six months.
Increased lifetime customer value by 15% through personalized engagement strategies.
Reducing Inventory Costs with Predictive Analytics: Built a demand forecasting model to optimize stock levels across warehouses.
Reduced excess inventory by 20%, cutting storage costs.
Improved stock availability, reducing lost sales due to stockouts by 10%.
Workforce Productivity Dashboard in Customer Support: Developed a dashboard monitoring ticket resolution times, agent workload, and customer satisfaction.
Optimized staffing schedules, reducing average resolution time from 5 hours to 3 hours.
Increased customer satisfaction scores by 10 points due to faster responses.
Great analysis starts with great awareness. Be mindful, be DataConscious.
Liked this article? Make sure to ❤️ click the like button.
Community needs your voice, do you have something to add? Feel free to comment.
Know someone that would find this helpful? Feel free to share this post.


